
Welcome to Aparavi Data Toolchain
The Aparavi Data Toolchain for AI (DTC) is the low-code/no-code developer tool that sits between your cleaned data (wherever it comes from) and your AI models, solving the fragmentation problem of managing multiple AI service APIs separately.
Why You Should Use DTC
- Eliminate Time Consuming Integration: Stop wasting your valuable time writing custom code to connect your cleaned data (from Aparavi Data Suite (ADS) or any other source) to embedding models, vector databases, and LLMs. DTC’s visual workflow builder lets you deploy AI pipelines in hours, not weeks.
- Universal Pipeline Builder: Whether your data comes from ADS or any other data preparation tool, DTC provides a unified interface to connect that prepared data to 2,000+ AI model integrations without coding.
- Rapid Prototyping to Production: Build and test complex RAG pipelines visually, experiment with different embedding models and vector stores, then deploy at enterprise scale – all through drag-and-drop workflows instead of managing multiple APIs.
- Future-Proof Your AI Stack: As new AI models and vector databases emerge, DTC adapts through its expanding component library, protecting your investment in pipeline development and preventing vendor lock-in to specific AI tools.
- ROI Through Speed: You get to focus on AI innovation and business logic instead of building and maintaining data plumbing infrastructure. Time saved on integration work directly translates to faster AI project delivery and revenue generation.
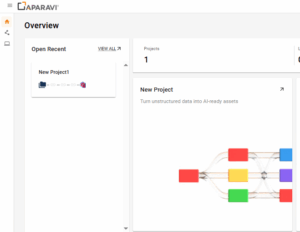
Basic Interface Overview
The Aparavi interface consists of several key areas:
- Access to project management, workflow execution, and settings
- Library of available components organized by category
- The main workspace where you build your workflow
- Configure the selected node’s settings
- View logs and execution results
Navigation
- Home
- Projects (with an existing project, or with no projects)
- System
Main Workflow Canvas
The Main Workflow Canvas is the core interface of the Data Toolchain for AI, where users build, visualize, and manage their data workflows.

Key Interface Elements
- Project Header
- Project Name Field – Allows you to name or rename the current project.
- Save Button – Saves the current state of the project.
- Delete Button – Deletes the current project.
- Log Viewer – Displays project logs when clicked.
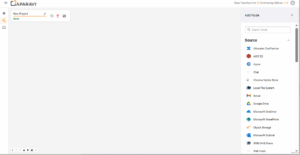
- Node Library – Organized into categories. Clicking a node will allow you to drag it into the canvas to start building your pipeline.
- Source – Connects to external systems and data repositories to bring raw or unstructured data into the workflow.
- Examples – Google Drive, AWS S3, Outlook, SMB/NAS, Local File System.
- Embedding – Transforms text or images into vector embeddings, enabling downstream AI models to work with structured representations of unstructured content.
- Example – Embedding – Image.
- LLMs – Large Language Models used to generate, summarize, classify, or transform text based on context or input from previous nodes.
- Database – Connects to SQL or NoSQL databases, allowing for queries, lookups, or data enrichment within a pipeline.
- Image – Handles image-specific tasks like resizing, format conversion, or preprocessing before embedding or analysis.
- Store – Used to write and persist processed output to a destination, such as cloud buckets, local drives, or database tables.
- Text – Text manipulation utilities such as extraction, formatting, cleansing, or splitting operations within the workflow.
- Audio – Processes audio input — this may include transcription, format conversion, or embedding audio for ML usage.
- Data – Utility nodes that help manage data structures, formats, and flow — such as joins, filters, or conditional logic.
- Infrastructure – Nodes for orchestration, automation, or triggering — potentially linked to Webhooks, schedules, or external systems.
- Source – Connects to external systems and data repositories to bring raw or unstructured data into the workflow.
- Canvas Area – Each workflow step is built visually here in the blank workspace by dragging and connecting nodes.
- Canvas Controls
- Zoom In / Zoom Out – Adjust canvas zoom level.
- Move / Pan – Navigate the canvas by dragging.
- Add Node Shortcut – Quickly access node library.
- Lock Canvas – Prevent accidental movement or edits.
- Reset View – Center the canvas view.


Creating your first pipeline in Aparavi Data Toolchain for AI
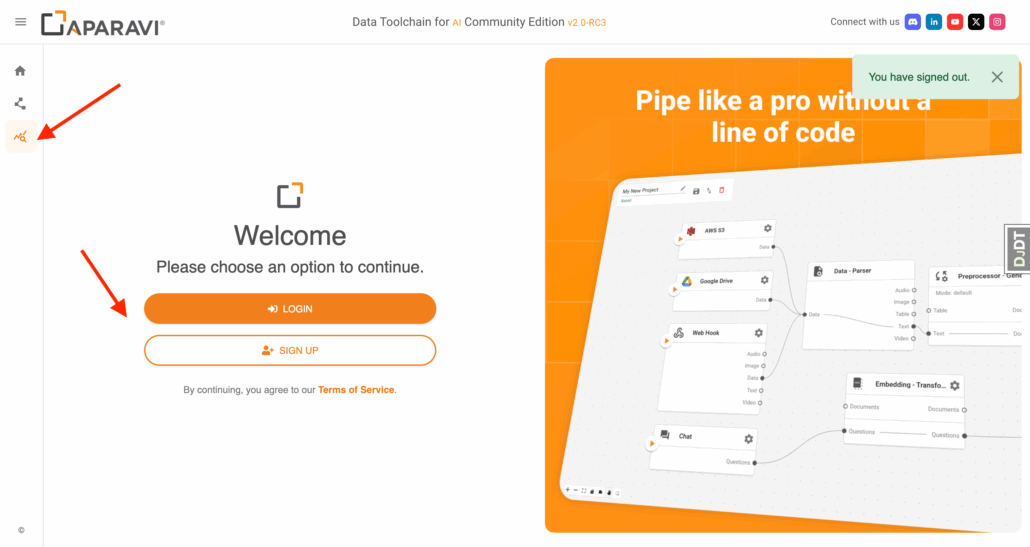
1. Sign up / log in
- Access: https://dtc-dev.aparavi.com/
- Left sidebar ▸ Usage ▸ Sign up (or log in)
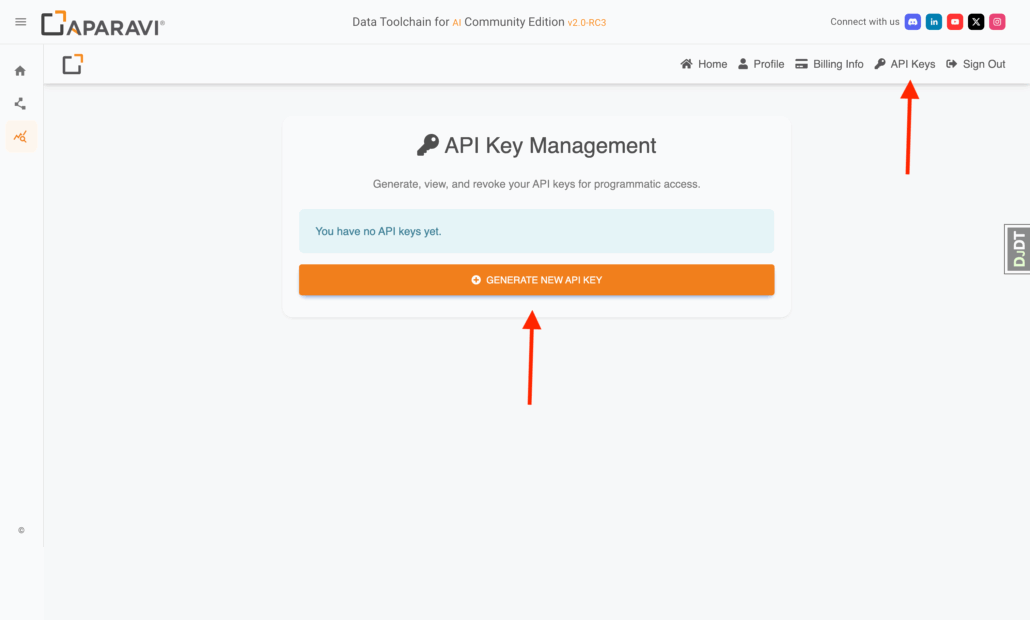
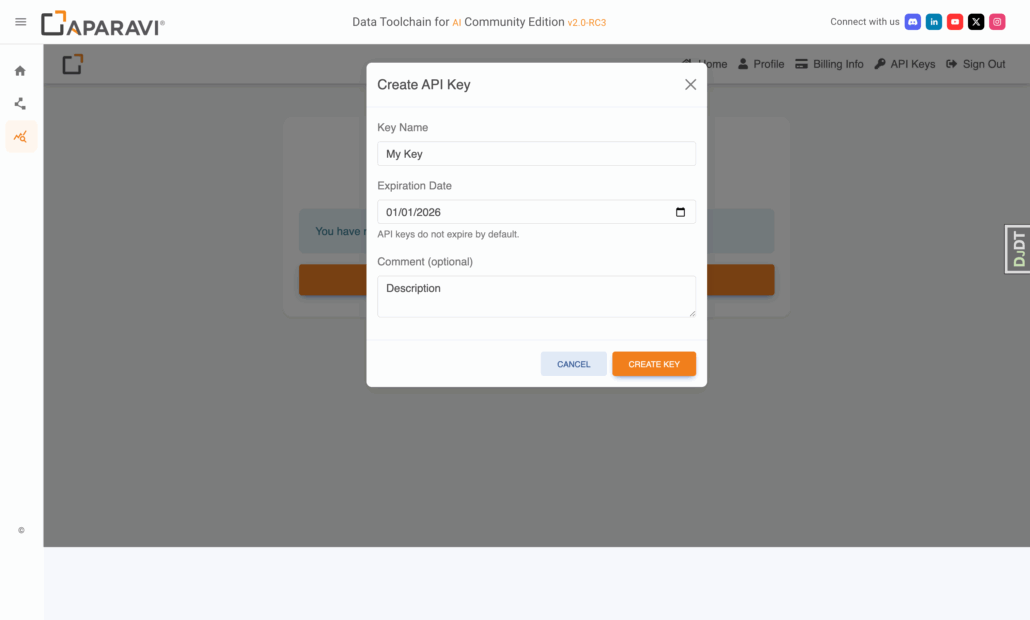
- Once inside, click API Keys (top-right) ▸ New key → name it, set optional expiry → Create → copy & save.
2. Open Projects
Top nav ▸ Projects ▸ pick a template Sample RAG Pipeline

3. Wire the flow (Simple Chat example)
- Drag your preferred LLM block (OpenAI, Gemini, …) into the canvas.
- Connect questions → questions, answers → answers.
- In the LLM block, paste its API key / org-ID, Save.

4. Run the pipeline
- Click Run. A prompt asks for your Aparavi API-key (the one you created in step 1).
- Paste key ▸ Submit – pipeline spins up; chat window appears in seconds.

5. Test & iterate
- Ask a question (“Capital of California?” → gets Sacramento).

- Swap demo data: delete Simple Data node, add Google Drive, S3, etc., connect it, Run again.